USING THE SPECTER NODE IN THE APP
Connect up to three wireless field sensors, tune thresholds per node, calibrate orientation, and capture synchronized evidence
The SPECTER Node is a small wireless field sensor with a magnetometer and a proximity antenna. Once it is on your network it appears inside SPECTER on its own rail widget, streams live telemetry, and can fire an evidence capture on its own. This page covers using a node you already have. To build one, see Build Your Own SPECTER Node.
- Pairing
- Three-node relay mesh
- Rail widget readouts
- Live traces in the rail
- Per-node alert thresholds
- Linking thresholds across nodes
- Audible alert mute
- App-side node controls
- Triggered snapshots (ENABLE)
- Display orientation calibration
- Direction Finder
- Node trajectory & convergence
- Node-to-node sync
- Expanded field vector view
- RF interference filter
- Multi-node diagnostic capture
- Per-node portal diagnostic log
- Node settings portal
- Link nodes to cameras
- Internet relay (off-Wi-Fi nodes)
- The snapshot trigger
PAIRING
SPECTER hosts the connection and the node finds it automatically. There is nothing to type in.
- Power the node on the same Wi-Fi network as the SPECTER computer.
- SPECTER broadcasts a discovery beacon on the network. The node hears it and connects back.
- Within a few seconds the node appears in the node rail widget with a live connection dot.
THREE-NODE RELAY MESH
SPECTER supports up to three Nodes. Direct Wi-Fi remains the preferred path. With Relay Assist enabled, a Node that cannot reach the app can forward through one nearby Node or through one intermediate Node for a maximum of two peer hops.
- Connect every Node directly first and assign a unique slot: Node 1, Node 2, or Node 3.
- Open Settings > Sensors & Alerts > SPECTER Node > Relay Assist.
- Generate one group key and apply it to the directly connected Nodes, or enter the same key in each Node's local portal.
- Place at least one Node where it retains a reliable direct app connection, then place the remaining Nodes outward through the location.
The Settings route list identifies direct and relayed Nodes, reports one-hop or two-hop paths, and shows channel, quality, command round-trip time, and dropped-frame estimates. Routes fail over automatically when another direct gateway is available.
RAIL WIDGET READOUTS
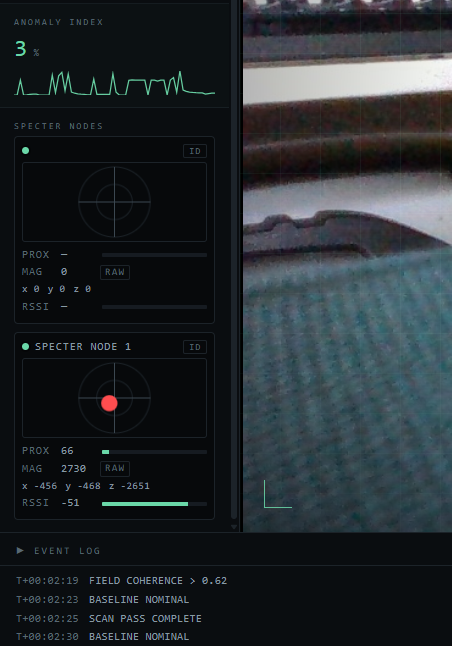
Each connected node gets its own panel in the bottom dock. The panel shows a live field mesh on the left and stacked MAG/PROX traces on the right, so you can see the current reading and the recent history at a glance.
| Readout | Meaning |
|---|---|
| Magnetometer amplitude | Combined field strength. Spikes when the local magnetic field shifts. |
| Proximity | Field near the antenna. Reads a higher value as something gets closer. |
| Connection | Live, or offline after a sustained loss of signal. |
| Mode tag | Shows whether the node is in touch mode or extended-range (RC) mode, and the current RC sub-channel. |
LIVE TRACES IN THE RAIL
Each node panel shows two 3-minute rolling traces: one for magnetometer amplitude and one for proximity. The traces use the same data buffer that the settings panel uses for threshold tuning, so the rail, the settings cards, and the wall displays always agree.
- Area fill shows the signal level over time. The trace holds peak values per 1-second bucket so short spikes are not averaged away.
- Amber hairline marks the current alert threshold. Anything crossing above this line would have triggered an alert.
- Red dots mark samples that crossed the threshold.
- Gaps (empty sections) mean the node was silent or disconnected during that period.
PER-NODE ALERT THRESHOLDS
Each node has its own MAG and PROX alert threshold. A node placed in a noisy room can run a higher threshold than one in a quiet corner, so each one fires only on genuine local changes.
The threshold card for each connected node is in Settings > Sensors & Alerts > SPECTER Node. Each card shows:
- Node name and slot at the top.
- MAG slider (0 to 100) and PROX slider (max follows the node's reported range, typically 100 for touch mode or 400 for extended-range RC mode).
- 3-minute trace under each slider showing that node's own signal against its own threshold, with threshold crossings dotted red.
The device is the single source of truth. The app reads the node's reported threshold from telemetry and the capture level follows it, including any guard band the node applies on top. There are no separate app-side snapshot trigger sliders that can disagree with the device.
LINKING THRESHOLDS ACROSS NODES
By default, each node's sliders are independent. You can optionally LINK the MAG or PROX threshold across all nodes so one global slider controls every node at once.
- In the threshold card, toggle LINK MAG or LINK PROX.
- When LINK is on, the per-node sliders disable and a single global slider appears.
- Flipping LINK on immediately levels every connected node to the current global value, so the slider cannot claim control it does not have.
- Turn LINK off to return to per-node control. Each node keeps whatever threshold it had when unlinked.
AUDIBLE ALERT MUTE
The AUDIBLE ALERT button in the detector bar is a master mute for every connected node. When muted, all node tones stop immediately, including the proximity alert beep, the boot tone, and diagnostic tones. The LED animations continue.
- The mute state is held centrally and re-sent to each node when it connects. A node that reboots mid-session comes back silent instead of chirping.
- The state persists across app restarts.
- The node's own audible setting (in the node portal) is the default for a fresh connection, but the app mute overrides it for the duration of the session.
This requires firmware 2.15.0 or newer. Nodes running older firmware will not respond to the mute command.
APP-SIDE NODE CONTROLS
In Settings > Sensors & Alerts > SPECTER Node, the app provides several rig-wide controls that affect every connected node at once:
- Enable SPECTER Node - master on/off for the entire node subsystem. When off, no node server runs, no rail widget appears, and no overhead is consumed. When on, the app starts a discovery beacon so nodes find this PC automatically.
- This PC (server) address - shows the IP address the app is listening on. If automatic discovery is blocked, you can type this into the node's config portal manually.
- IDENTIFY ALL (BLINK) - sends a blink command to every connected node so you can physically identify which node is which. Useful when all three are on a table and you need to match a node to its slot.
- REBASELINE ALL - sends a rebaseline command to every connected node simultaneously. Each node re-zeroes both sensor channels to the current ambient field. Step away from all nodes before pressing it. Use this when you move to a new location or when the room's ambient field has drifted.
- Node route list - shows each discovered node with its IP address, slot, connection state, and transport type (direct or relay). Click a node's address to open its web portal in a browser.
TRIGGERED SNAPSHOTS (ENABLE)
The ENABLE toggle in the detector bar controls automatic evidence capture. When ENABLE is off, SPECTER continues to detect and display anomalies on screen, including the anomaly dialog, rail flash, and hit log entries, but does not save a gallery item for automatic captures.
- ON (default): automatic captures from depth detection, node threshold crossings, and tracking intervals all save to the gallery as normal.
- OFF: detection still appears on screen, but no automatic evidence is written. Manual snapshots (F7 or the snapshot button) still work.
DISPLAY ORIENTATION CALIBRATION
Each node can be calibrated so the on-screen direction finder arrow points the way the real world does. This is purely a display transform, it rotates the on-screen vector to match how the physical node is oriented in the room. It does not change detection, baselines, thresholds, or any sensor readings.
How to calibrate
- In the node's threshold card, find the Display Orientation section.
- Hold a magnet at the pod's physical FRONT and press the FRONT button. The arrow should swing to point "up" for that direction.
- For better accuracy, also hold the magnet at BACK, LEFT, and RIGHT and press the matching buttons. FRONT alone gives a usable rotation; FRONT plus BACK averages out the room's static field; LEFT and RIGHT reveal whether the pod is left or right-handed.
- The status line reads ALIGNED with the rotation angle in degrees, and MIRRORED if the pod is left-handed.
- Press CLEAR to reset orientation and start over.
Orientation is saved per node, so each node remembers its own rotation. The oriented vector is published to the wall's direction finder and the rail; the raw unrotated vector rides along as magRaw.
DIRECTION FINDER
The Direction Finder is a top-down compass radar in the Instrument Bay on a second screen. It shows not just how strong a magnetic disturbance is, but which direction it is coming from.
With multiple nodes connected, the direction finder draws one needle per node, each with independently smoothed angle and amplitude so they do not snap. The dominant node (strongest signal) keeps the solid arrow; other nodes draw dashed, dimmer, color-coded, numbered needles.
- Bearing needle swings toward the source of the magnetic disturbance.
- Proximity ring closes in toward the center as something gets nearer to a node.
- Each node's needle is numbered to match its slot (1, 2, 3) and color-coded.
- When nodes converge on the same bearing, the arrows agree and point toward the same location from different positions, giving you a triangulation read.
NODE TRAJECTORY & CONVERGENCE
When two or more nodes fire threshold events close together in time, SPECTER correlates them and shows a Node Trajectory readout at the bottom of the screen. This tells you not just that multiple nodes triggered, but the sequence and timing between them, which can reveal the direction and speed of something moving through the space.
How it works
- SPECTER watches for threshold-crossing events from all connected nodes within a rolling 1.2-second window.
- When two or more nodes fire in that window, the trajectory HUD appears showing the sequence:
NODE 1 -> NODE 2with millisecond offsets:T+0 +234ms. - The HUD auto-hides after 5 seconds of quiet.
- If a node has a camera link, its mapped camera highlights immediately when that node fires.
Three-node convergence
When all three nodes fire within the same 1.2-second window, SPECTER shows a THREE-NODE CONVERGENCE alert at the top of the screen with the full sequence and total span in milliseconds. This is a significant multi-sensor event worth noting in your investigation log. The convergence alert has a 4-second refractory so a single burst does not repeat the toast.
NODE-TO-NODE SYNC
The SYSTEM tab in the node portal has a SYNC ALL button that copies this node's tuning to every other node on the same local network. This is useful when you have dialed in one node's sensitivity, LED configuration, and alert timing and want every node to match.
What gets synced
- Magnetic sensitivity, proximity mode, threshold, span, noise floor, and curve
- Extended-range (RC) margin and floor settings
- Theremin on/off and tone curve
- Alert duration, cooldown, arm time, heartbeat resume, and minimum animation hold time
- Telemetry rate
- Full LED configuration: chipset, color order, pin assignments, count, brightness, positional map (front/right/back/left), rotation, flip, six event colors, both animation selections, boot colors, and boot animation
- Heartbeat enabled state and color
What is NOT synced (deliberately)
- Slot and node name - identity stays with the physical node.
- Wi-Fi credentials and relay URL - a sync must never strand a node.
- Touch pin and pin swap - these are per-node physical wiring.
- Field lock and audible alerts - these are live controls the app drives rig-wide.
EXPANDED FIELD VECTOR VIEW
Double-click any node's field mesh in the bottom dock (or click the NODE grid button) to open the expanded Field Vector overlay. This replaces the center feed with a large magnetic vector display and a full tuning panel for that individual node.
What it shows
- Magnetic vector canvas - a large real-time mesh showing the direction and amplitude of the magnetic field. The lobe points toward the side nearest the source.
- MAG amplitude - the combined field strength (raw units).
- X / Y / Z - the three raw magnetometer axes, so you can see which axis is driving a change.
- Proximity - the current capacitive field reading (higher = closer).
- Link RSSI - Wi-Fi signal strength in dBm. Closer to 0 is stronger. Useful for diagnosing intermittent drops.
Tuning controls in the expanded view
- SET BASELINE - CALIBRATE THIS ROOM - sends a rebaseline command to this node only. The node re-zeroes both sensor channels to the current ambient field. Use this when you move a node to a new position or when the room's baseline has drifted. Step away from the node before pressing it, or your own field will be measured as the new baseline.
- MAG SENSITIVITY (0.1x to 3.0x) - a display multiplier for the magnetic trace amplitude. Does not change the alert threshold; affects only how prominently the magnetic signal renders on screen.
- PROX SENSITIVITY (0.1x to 3.0x) - same, for the proximity trace.
- MAG ALERT THRESHOLD - the raw trigger level for magnetic alerts on this node. Anything crossing above this triggers an event.
- PROX ALERT THRESHOLD - the raw trigger level for proximity alerts on this node.
Press Esc or click the X in the top-right corner to close the expanded view and return to the normal feed.
RF INTERFERENCE FILTER
The expanded field vector view includes an RF filter panel for recording-mode operation. This lets you capture and suppress the magnetic signature of known interference sources (crew radios, fluorescent ballasts, nearby electronics) so they stop generating false proximity alerts.
How to use it
- Open the expanded view for the node you want to filter.
- While the interference source is active (hold a crew radio key, or position the node near the ballast), press and hold HOLD TO CAPTURE INTERFERENCE.
- The node records the magnetic signature of the source. Release the button when the capture is done.
- The captured signature appears in the RF list below the button, labeled with the date and time.
- Toggle SUPPRESS MATCHES to enable filtering. When on, the node will suppress proximity alerts that match a captured RF signature instead of firing a detection event.
MULTI-NODE DIAGNOSTIC CAPTURE
When you have two or three nodes running side by side and they behave inconsistently (one over-triggers, another is sluggish, a third has a noisy baseline), the CAPTURE ALL (2 MIN) button in Settings > Sensors & Alerts > SPECTER Node fires the same 2-minute field-capture log at every connected node simultaneously and compares them side by side.
What it does
- Press CAPTURE ALL (2 MIN) in Settings, under the SPECTER Node section. The button text changes to "CAPTURING..." and the status line shows per-node progress.
- Each connected node starts recording its raw sensor data at ~20 Hz for 2 minutes: proximity delta, magnetometer delta, RC capacitance charge/fault state, alert phase, and Wi-Fi RSSI.
- When the capture window ends, the app downloads all the CSVs automatically, computes per-node statistics, and flags any node whose numbers stand out from the group.
- A folder opens on your desktop containing one CSV per node, a SUMMARY.txt with the comparison, and a manifest.json.
What the stats mean
- PROX baseline (mean + stdev) - the resting noise floor of the proximity antenna during quiet periods (no alerts). A node with a much higher stdev than its siblings likely has a wiring or antenna-length difference causing more electrical noise.
- MAG baseline (mean + stdev) - same, for the magnetometer channel. A higher stdev here means the magnetometer is picking up more ambient magnetic variation, which could be placement (near a metal surface) or wiring.
- RC fault rate (%) - percentage of samples where the RC capacitance sensor reported a fault. A high fault rate (above a few percent) indicates a hardware issue with the antenna circuit on that node, not a sensitivity problem.
- RSSI (dBm) - average Wi-Fi signal strength. A node with significantly worse RSSI than the others may drop intermittently or deliver delayed telemetry, which can look like erratic behavior in the app.
- Alert counts - how many rows crossed the threshold during the capture. If one node fired many more alerts than the others in the same environment, its threshold is likely too low for that location, or its baseline noise is high enough to cross it.
PER-NODE PORTAL DIAGNOSTIC LOG
Each node's own web portal (at its LAN IP address, or 192.168.4.1 when on its setup Wi-Fi) includes a CAPTURE 2 MIN LOG button on the main page. This records ~2 minutes of raw sensor data at ~20 Hz and lets you download it as a CSV file.
How to use it
- Open the node's web portal in a browser (find its IP address in Settings, under the node route list, or join its setup Wi-Fi and go to 192.168.4.1).
- Press CAPTURE 2 MIN LOG. The button changes to "CAPTURING..." and a status line shows the row count and time remaining.
- When the capture finishes, a DOWNLOAD CSV button appears. Click it to save the file.
CSV columns
- ts_ms - timestamp in milliseconds since boot
- rc_charge_us_x100 / rc_base_us_x100 - RC capacitance charge time and baseline (in microseconds x 100)
- rc_ok / rc_fault - whether the RC sensor reported a valid reading or a fault for this sample
- prox_delta - proximity delta (raw sensor reading above baseline)
- prox_alert - 1 if this sample crossed the proximity alert threshold, 0 otherwise
- sat_armed - 1 if the proximity sensor was in armed (saturated) mode
- mag_delta - magnetometer delta (combined three-axis amplitude change)
- mag_alert - 1 if this sample crossed the magnetic alert threshold, 0 otherwise
- alert_phase - current alert state machine phase
- rssi_dbm - Wi-Fi received signal strength in dBm
- rc_timeout_us - RC sensor timeout threshold in microseconds
The portal also has a stall log (visible at /diag/stalls) that records any time the node's main loop blocked for more than 40 ms, which is useful for diagnosing intermittent portal or telemetry freezes.
INTERNET RELAY (OFF-WI-FI NODES)
For nodes that cannot be on the same Wi-Fi network as the SPECTER computer (for example, a node placed in a separate building with internet access), SPECTER can generate a secure relay URL that the node uses to connect over the internet through a Cloudflare tunnel.
Setup
- In SPECTER, go to Settings > Sensors & Alerts > SPECTER Node.
- Find the Internet relay URL field (labeled "for nodes off your Wi-Fi").
- Click COPY RELAY URL to copy it to your clipboard.
- Open the node's own web portal and paste the URL into its Internet Relay field.
- Save and reboot the node. It will connect to your SPECTER over the internet instead of local Wi-Fi.
NODE SETTINGS PORTAL
Each node hosts its own web portal at 192.168.4.1 when you join its setup Wi-Fi (named SPECTER-NODE-01, SPECTER-NODE-02, etc.). The portal has several tabs for configuring the node directly, without the app.
Wi-Fi tab
- Connect the node to your field network. Enter SSID and password, then save. The node reboots and joins your network.
- If the node was previously on a different network, saving new Wi-Fi credentials clears the stale connection state so it does not try the old network first.
Settings tab
- Slot assignment - set Node 1, 2, or 3. Each node on the same app must have a unique slot.
- Node name - a friendly name shown in the app rail and settings.
- Sense source - choose basic touch mode (antenna on GPIO4) or extended-range RC mode (GPIO18 drive through a 1M resistor to GPIO4). Extended-range mode gives roughly 10x the proximity resolution.
- Magnetic sensitivity (0 to 100, default 70) - how large a magnetic delta is needed to trigger an alert. Lower is more sensitive.
- Proximity threshold - the raw trigger level. The node applies a guard band on top, so the effective trigger threshold is slightly higher than what you set.
- Proximity span - maps the raw sensor delta to the 0 to 100 field reading shown in the app. A larger span means the field reading rises more slowly as something approaches.
- Alert duration - how long the LED animation runs after a threshold crossing.
- Cooldown - minimum time between alerts on the same channel.
- Minimum animation hold (0 to 10 seconds, default 2) - the LED animation runs for at least this long even on a quick pass, so you get a recognizable pattern instead of a stutter. Clamped to alert duration, so a 1-second alert yields 1 second, not 2.
- Telemetry rate (default 10 Hz) - how often the node sends readings to the app.
LED tab
- Chipset - WS2812B (RGB) or SK6812 (RGBW). The node auto-detects and rebinds RGBW rings correctly.
- Color order - GRB, RGB, RGBW, etc.
- LED count, brightness, data pin, clock pin - match your hardware.
- Positional map - assign which LED physically faces front, right, back, and left. This is what makes the directional mag lobe point the right way.
- Rotation and flip - rotate or mirror the LED layout to match how the ring is mounted.
- Event colors - three colors per channel (mag and prox). Each color is used by different animation patterns. Colors A, B, and C let multi-color patterns like theatre chase, color wipe, and gradient cycle use contrasting hues.
- Animation (0 to 13) - 14 patterns: solid/directional, pulse, spin, blink, theatre chase, strobe, dual comet, ripple, color wipe, sparkle, gradient cycle, halves, breathe blend, and radar. Patterns 0 to 3 use color A only and are unchanged from older firmware; patterns 4 to 13 use all three colors.
- Boot colors and boot animation - what the ring does when the node powers on.
Theremin tab
- Theremin on/off - turns the proximity antenna into a continuous audible field. As an influence nears the node, the LED ring glows up and the tone rises in pitch.
- Tone curve - linear or sqrt (Natural). Sqrt gives a more musical response.
- Refit range - re-measures the proximity span from the strongest hand delta. Hold your hand at the intended sensing distance and press refit.
- Jitter deadband - raises the noise floor so the field rests at zero when nothing is near.
System tab
- Sync All - copies this node's tuning to every other node on the LAN. See Node-to-node sync above.
- Audible alerts - master on/off for all node tones (prox beep, boot tone, diagnostic). Default is on. The app's AUDIBLE ALERT button overrides this during a session.
- Firmware version - shows the current version and checks for OTA updates.
- OTA update - downloads and installs new firmware from the SPECTER servers. The node reboots automatically after the update.
LINK NODES TO CAMERAS
Use Node to Camera Links to assign each Node slot to the Lorex or IP camera covering the same position. An unlinked Node remains global and is marked UNASSIGNED.
When a genuine Node event arrives, the mapped camera highlights immediately and becomes the primary observation view. Evidence metadata continues to identify the Node as the true trigger. The linked-camera capture offset can delay only the saved camera frame from 0 to 2500 ms to compensate for RTSP latency and show the Node LEDs.
THE SNAPSHOT TRIGGER
Arm the snapshot trigger and SPECTER will capture an evidence frame automatically whenever a sensor delta crosses your alert threshold. Magnetic crossings and proximity crossings are evaluated separately, each with its own short cooldown so a noisy room does not flood the gallery.
Each auto-capture lands in the gallery like any other detection, with its type, confidence, and synchronized timecode.
If you want detection to appear on screen without saving evidence, turn off the ENABLE toggle in the detector bar.